Research
Remote sensing, machine learning, and environmental/geospatial data infrastructure for projects that need to be useful on the ground and in the lab.


Current work spans irrigation mapping in Sub-Saharan Africa, national-scale forest change analysis, and cloud-accessible wildfire resilience tools.
That work currently lives across the WaVeS Lab, the LOC Lab, and my capstone with the Wildfire Resilience Index team at NCEAS.
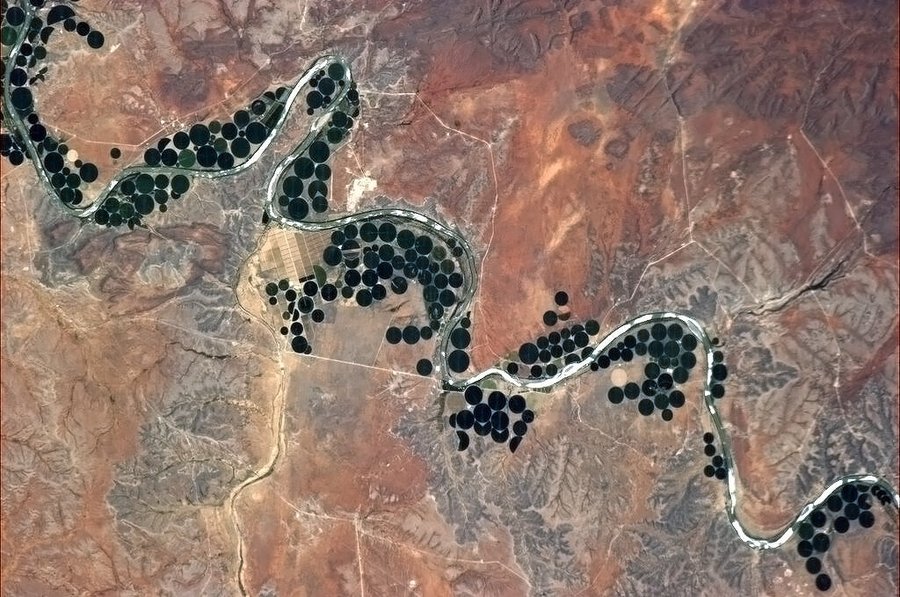
Satellite-Based Irrigation Mapping in Sub-Saharan Africa
Lab: UCSB Water Vegetation and Society (WaVeS) Lab, Prof. Kelly Caylor
Timeline: June 2024 - Present
Status: In Progress
At WaVeS, I contribute to a broader research program on irrigation expansion, water access, and agricultural change in Sub-Saharan Africa, with several linked papers currently in progress. My part of that work focuses on where irrigation growth is happening: whether expansion over the past two decades has been concentrated inside major command areas or has emerged more diffusely through decentralized systems.
I work closely with Prof. Kelly Caylor and Anna Boser, who has been an important advisor and mentor throughout the project. Anna’s work on small-scale irrigation and agricultural systems helps ground the broader research agenda, and related technical development in this pivot-detection repository is part of the larger infrastructure that this work can both contribute to and benefit from.
Alongside the paper pipeline, I have also been developing a separate center-pivot segmentation workflow following Chen et al., using CNN and U-Net style semantic segmentation on Landsat imagery. The immediate goal is to build a 2015 detection layer that can be compared on the right temporal footing with existing irrigation and agriculture datasets. That segmentation work is useful supporting infrastructure, but it is not required for the publication track itself.
Technical details: My current WaVeS workflows use Python geospatial pipelines built with Rasterio, GeoPandas, and Shapely to process multiband raster and vector datasets such as aridity indices, AEI layers, and CPIS shapefiles across heterogeneous sources. In parallel, I have been testing a Chen-style center-pivot segmentation workflow to generate a 2015 detection dataset that can support temporally aligned comparisons with existing irrigation and agricultural products.
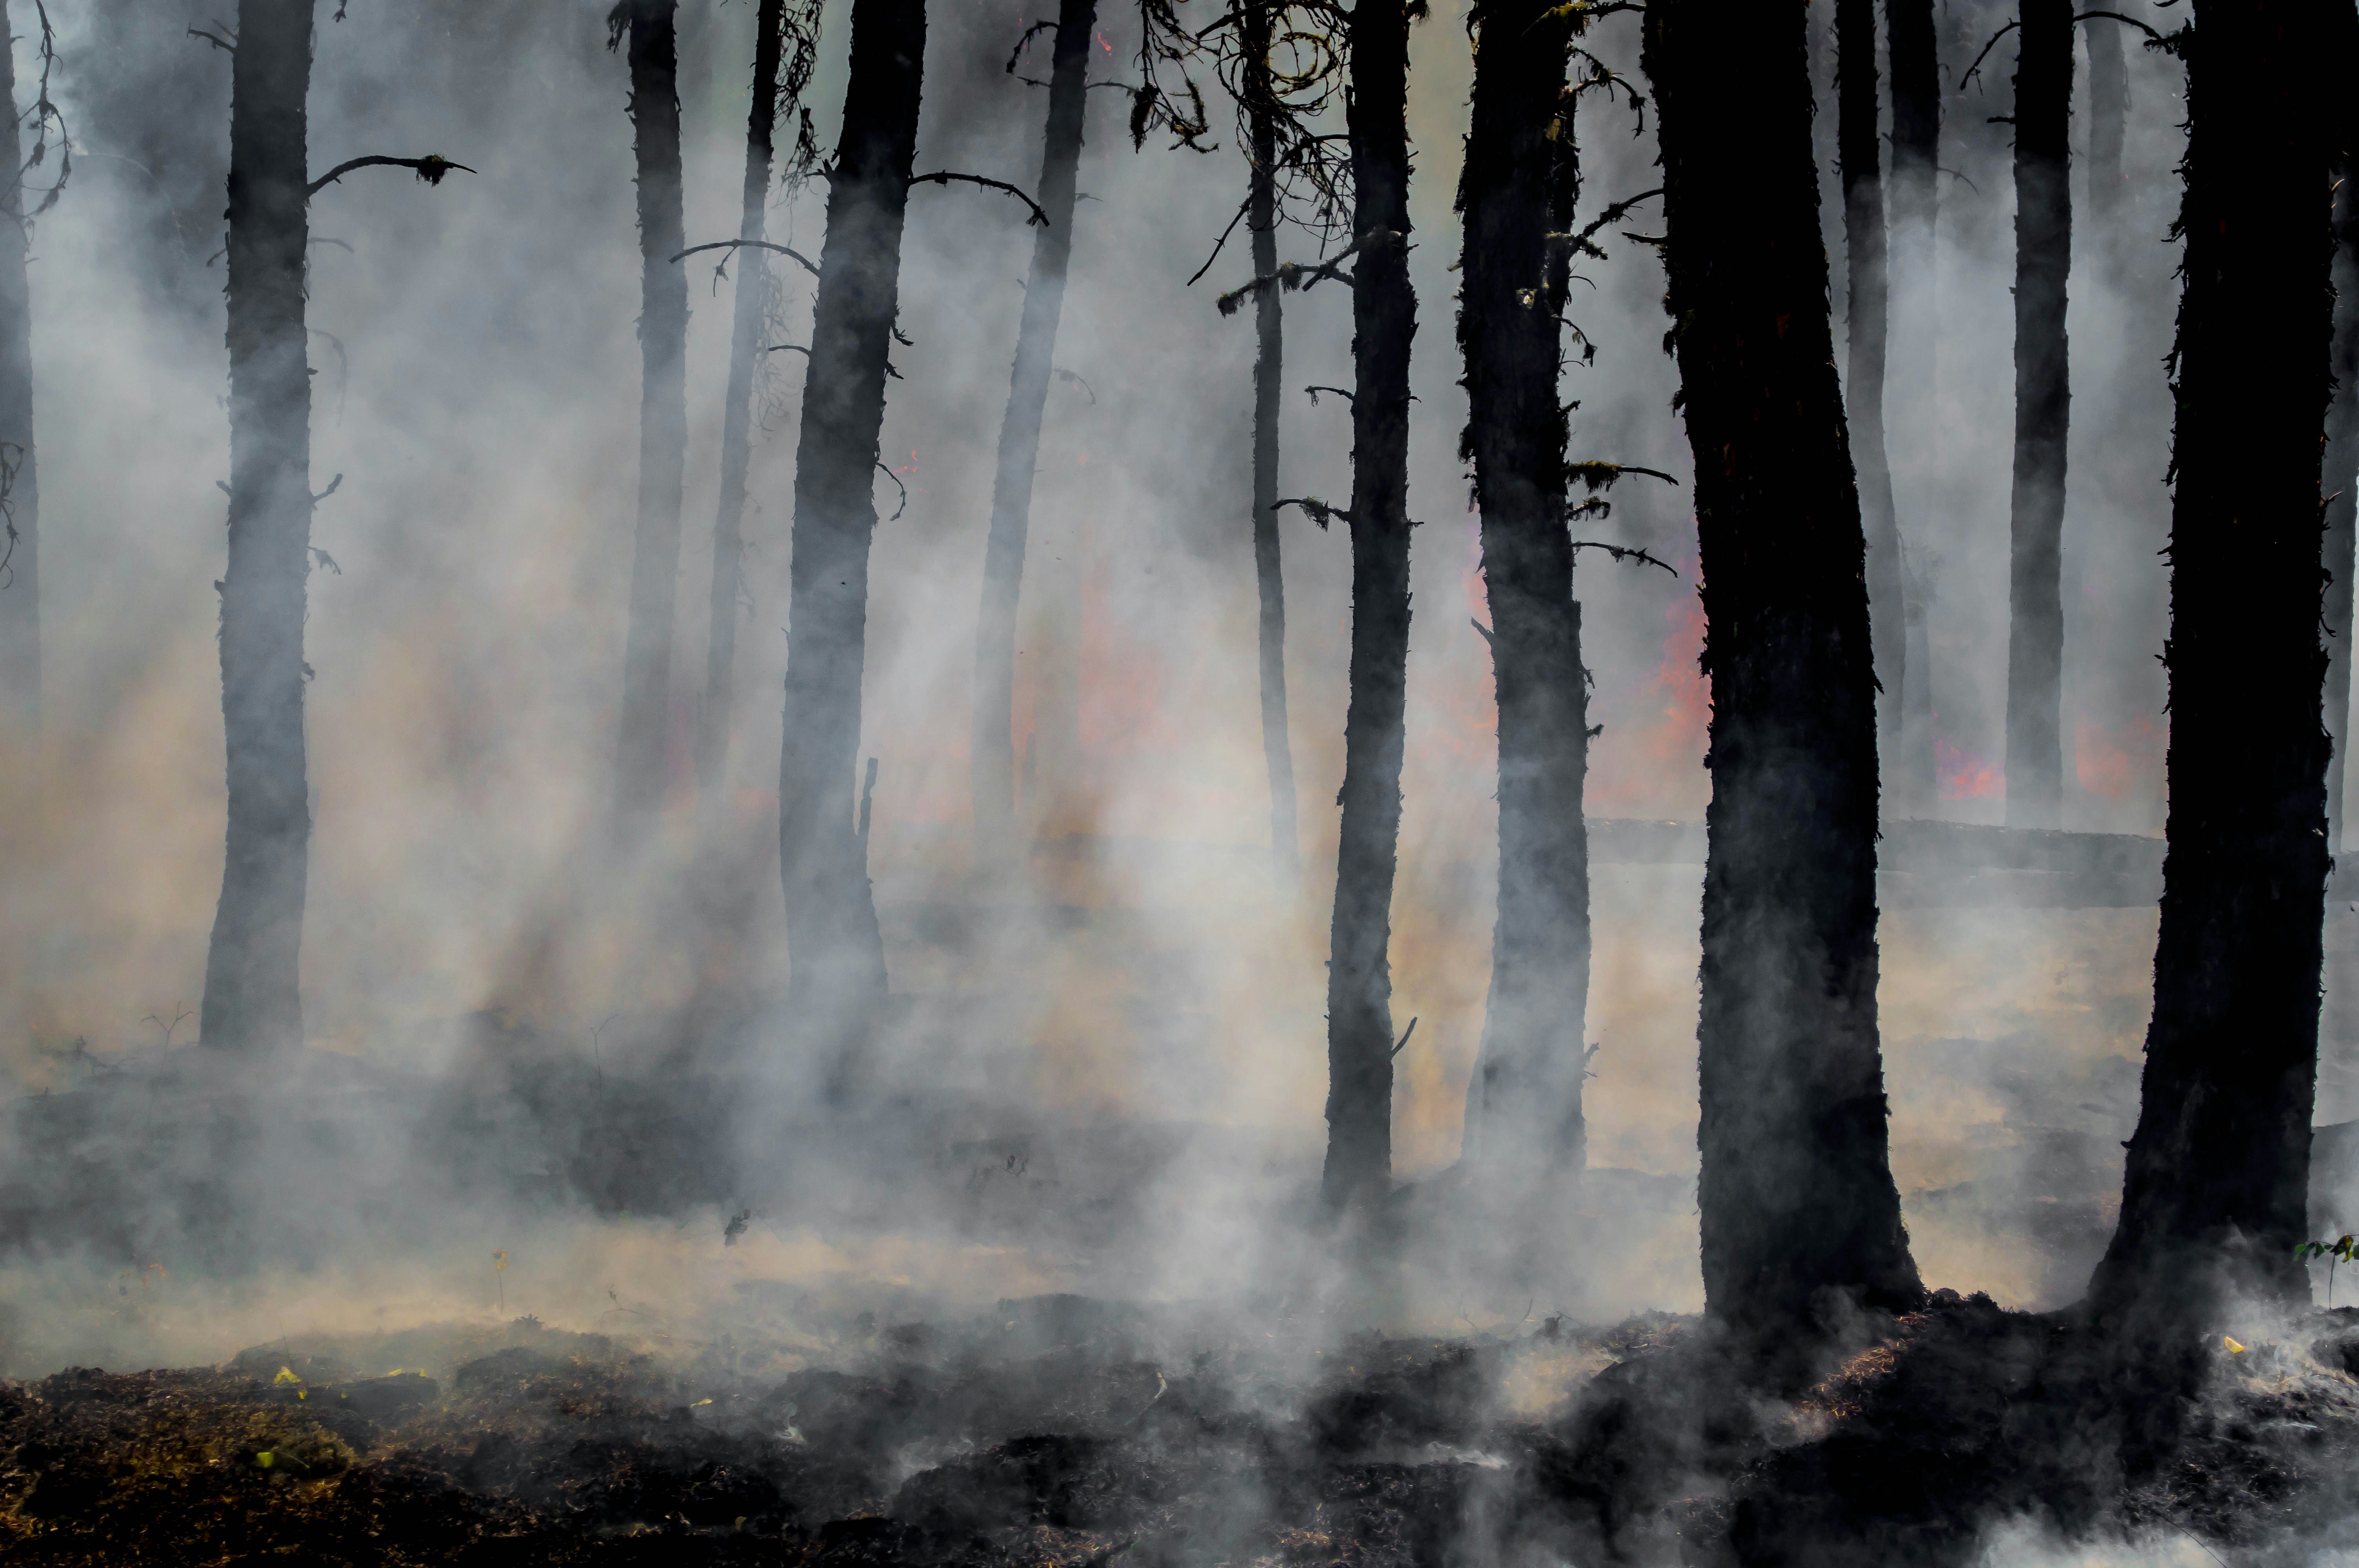
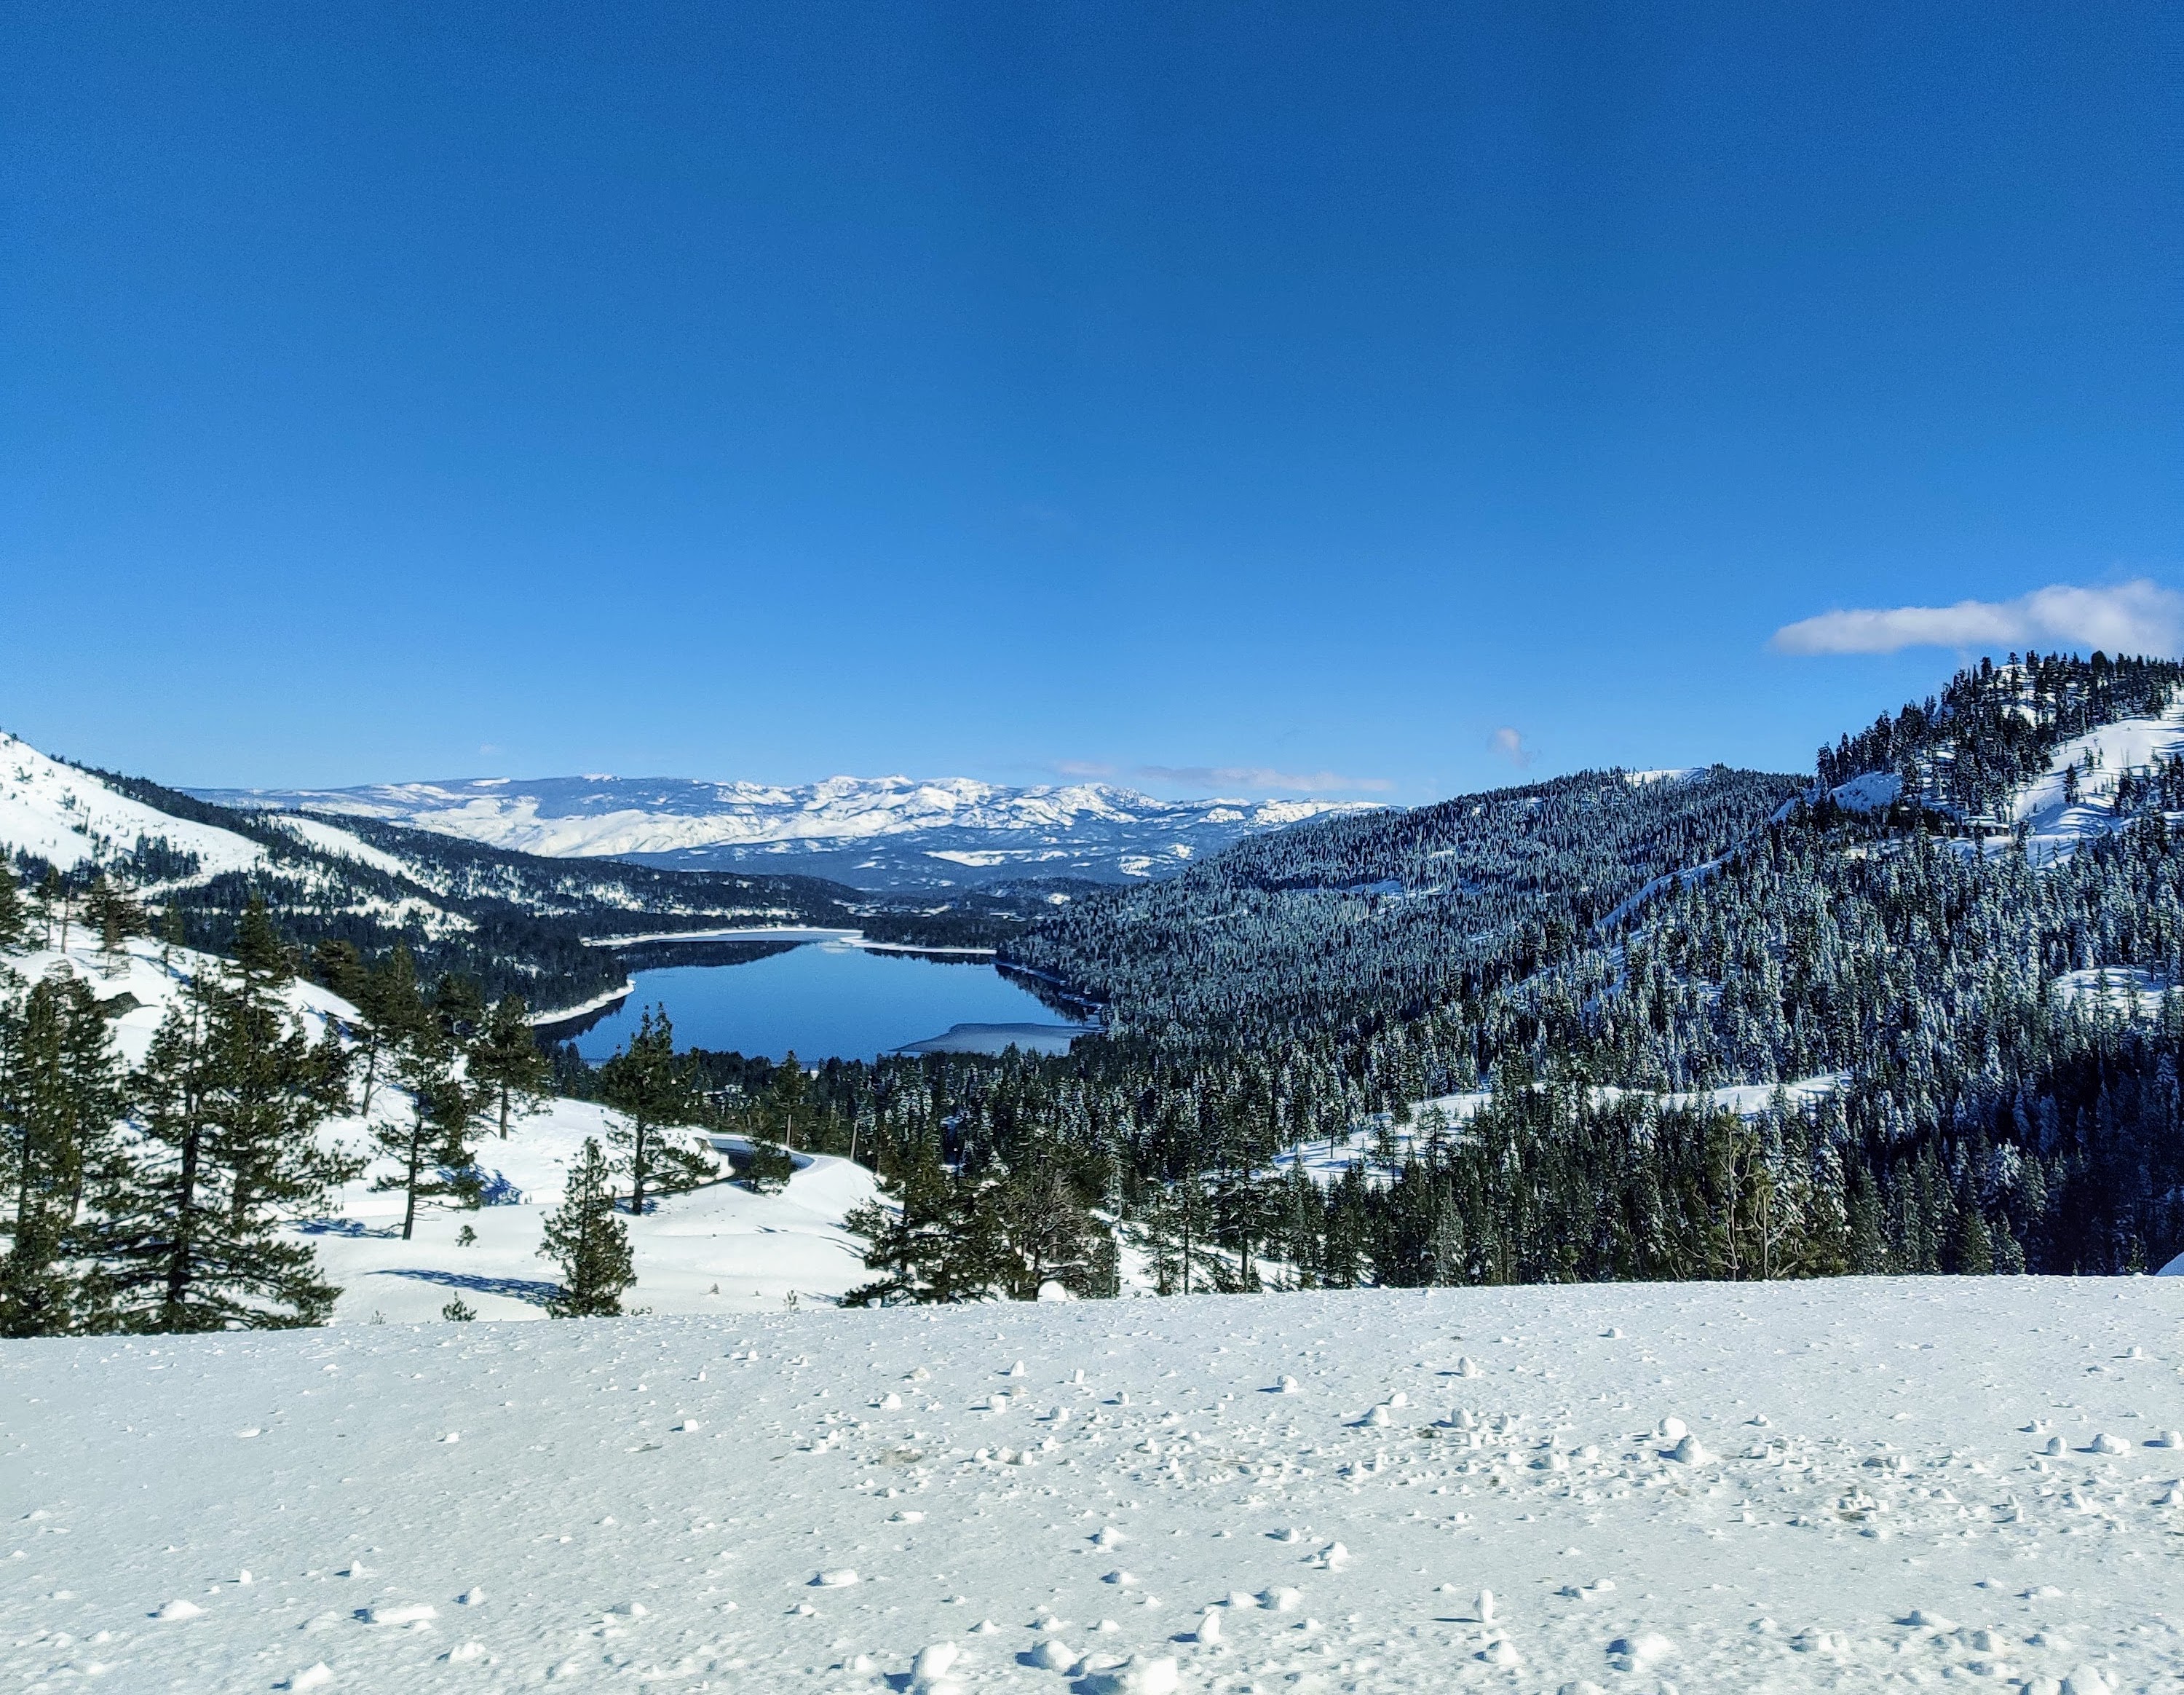
Forest Thermophilization & Disturbance Analysis
Lab: Landscapes of Change (LOC) Lab, Bren School, UCSB
Timeline: January 2026 - Present
Status: In Progress
The LOC Lab investigates how forests are changing in response to climate and disturbance: thermophilization (the shift toward warmer-adapted species compositions), fire, insects, drought. I’m building and maintaining the data infrastructure that makes this analysis possible at national scale.
The core pipeline integrates five federal datasets, USDA Forest Service aerial disturbance surveys (IDS), TerraClimate, PRISM, WorldClim, and the Forest Inventory and Analysis database (FIA), across ~4.47M records and ~300 GB of processed output. Key elements of the work:
- Pixel decomposition architecture - Spatially links forest disturbance polygon observations to gridded climate data using area-weighted joins, extracting pixel-level values via Google Earth Engine across all climate datasets
- Plot-level FIA summaries - Tree metrics, diversity indices, disturbance history, and site-level climate records (1958-present) for thermophilization analysis across ~7,000 permanent FIA sites
- Reproducible pipeline design - Centralized YAML configuration, renv for R environment management, config-driven architecture built to be sustained and extended post-project
I also built the FIA Database Schema Navigator, a Streamlit tool for exploring the FIADB v9.4 schema without loading the full 70 GB SQLite file, along with two downstream dashboards for compiled data QA and full project exploration. Details in the blog post and repository.
Technical details: R and Python pipelines integrating IDS, TerraClimate, PRISM, WorldClim, and FIA. Google Earth Engine pixel decomposition with area-weighted coverage fractions. Streamlit dashboards for schema navigation, data exploration, and project documentation. renv and YAML config-driven reproducibility.
Wildfire Resilience Index Data Access & R Package
Client: National Center for Ecological Analysis and Synthesis (NCEAS), Dr. Caitlin Fong
Timeline: January 2026 - Present
Status: In Progress (MEDS Capstone)
This capstone project focuses on making the Wildfire Resilience Index (WRI) usable without asking people to download several terabytes of raster data. Working with my capstone team, I am helping turn 100+ wildfire resilience layers into cloud-accessible geospatial assets and build an open-source R package that lets users discover, subset, and visualize the data directly.
Key pieces of the work:
- Cloud-ready geospatial archive - Converting 100+ WRI raster layers to Cloud-Optimized GeoTIFFs (COGs), with metadata structured for reproducible public access
- STAC-based discovery - Organizing the archive in a SpatioTemporal Asset Catalog (STAC) so users can find layers by domain and query data programmatically
- R package development - Building functions for catalog queries, spatial subsetting, and visualization so researchers and practitioners can work with the data without managing huge local files
- Client handoff infrastructure - Documenting the processing pipeline so future WRI releases can be updated and maintained by the client team
Technical details: R package development with terra, sf, rstac, and testthat, paired with GDAL-based TIFF-to-COG conversion, STAC metadata generation, and public data hosting through the Knowledge Network for Biocomplexity (KNB).
Proposed Projects
Scaling Metadata Quality Assessment for Environmental Data Repositories
Client: Arctic Data Center / National Center for Ecological Analysis and Synthesis (NCEAS)
Timeline: Fall 2024 - Spring 2025
Status: Proposed capstone project (not currently in progress)
This was a proposed capstone direction focused on building reproducible, scalable workflows to aggregate and visualize FAIR (Findable, Accessible, Interoperable, Reusable) metadata quality assessments across environmental data repositories.
Project Goal: Currently, the Arctic Data Center runs automated metadata checks generating per-dataset results, but aggregated results are not readily available. With thousands of datasets, it’s difficult to identify systemic curation issues such as missing ORCIDs or inconsistent units. This project transforms individual metadata quality assessments into standardized, scalable, and actionable insights.
Key Deliverables:
- Repeatable ingest pipeline - Clean, timestamped snapshots of quality assessment data enriched with dataset metadata, with validation to catch data format changes early
- Automated visualizations and analysis - Generate FAIR pillar summaries, temporal trends, and first vs. latest comparisons that auto-update when new data arrives
- Focused deep-dives - Analyze specific dataset types or disciplines, regroup individual checks into themes, and track percent-pass and patterns across time
- Lightweight access interface - Simple filterable web interface to view and download tables, figures, and summaries by time, metadata standard, pillar, or dataset type
- Stretch goal - Configure one additional repository with the same framework to demonstrate portability
Technical Approach: Building reproducible workflows in Python with open data formats (CSV, Parquet). Using Quarto/Jupyter for reports. Emphasis on lightweight, maintainable design that repository staff can sustain post-project.
Impact: This project enhances Arctic research data accessibility and usability by turning existing checks into clear, repeatable quality signals. Plain-language, FAIR-aligned metrics reduce barriers for research teams, particularly those with limited institutional data support, promoting equitable participation in environmental science. The scalable framework offers a model for other repositories, improving the connected environmental data ecosystem.
Broader impact: Plain-language metrics and transparent interfaces can make environmental data quality issues easier to see, compare, and act on across repositories. The larger goal is to turn existing checks into something more useful for curation teams and more legible for the people who depend on those repositories.